User Tools
Site Tools
Navigation
Internships & Projects
Raspberry Pi
Code Embarqué et Temps Réel
SE et Pilotes
[Protected]
Table of Contents
ARM toolchain
In order to compile code from an architecture (e.g x86) to another (e.g ARM), you need a cross-compiler.
The toolchain is already available through the $ARM_HOME environement variable which is already part of your $PATH variable.
Please note that all commands are arm-eabi- prefixed, exemple:
<user>@archix[~]: arm-eabi-gcc
This will call GDB, the GNU debugger.
Eclipse is the graphical development environment we will use. It provides a convenient way to interact with the toolchain.
In the following, we'll explain the two target available for code debugging:
Please note that the Cross-ARM toolchain has been built from scratch and is using statically linked libraries: this makes it possible to run on any linux system featuring the same architecture.
ARM virtual machine
Building its own cross-compilation tool-chain is everything but a nice and funny thing to do!
So, to help those of you who'd like to simulate their ARM code with the arm-eabi-gdb simulator, we provides a ready-to-use fully featured VM. This VM hosts both the cross-compilation tool-chain along with latest Eclipse version and a sample code that will teaches you the way the simulator ought to be launched.
Fully featured VM with arm + eclipse We provide a VirtualBox image that contains the ARM cross-compilation tool-chain along with Eclipse here.
Simulator
The ARM instruction set simulator is part of the GNU debugger arm-eabi-gdb.
In order to use it through Eclipse, we describe below a step by step procedure:
#> eclipse
Note: Eclipse will fails if you try to launch it from the server, rather use one of the archi[1..18] compute nodes.
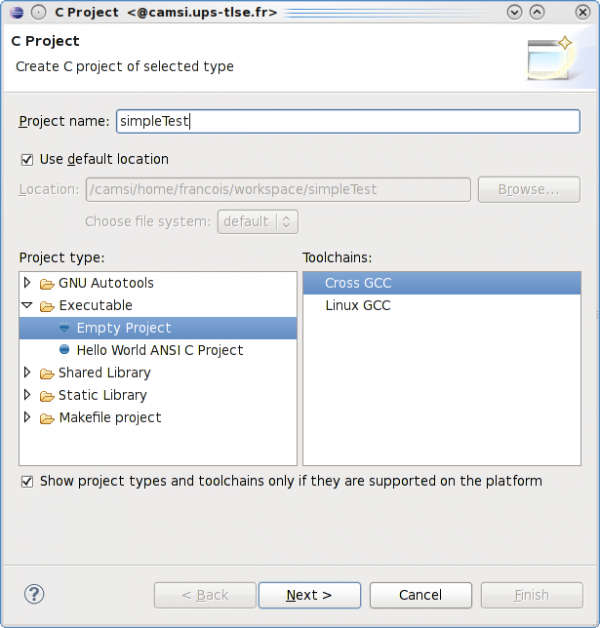
Now, you will create a New Empty C project and select the Cross GCC toolchain …
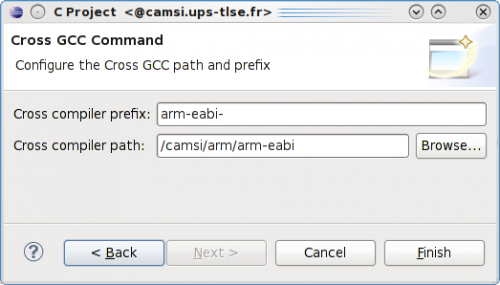
As stated above, all binaries from our ARM toolchain feature a prefix arm-eabi- we will specify it right now along with path to the toolchain itself
Having done the basic setup, we'll now create a new source file with the following code:
- test.c
void _start(int argc, char**argv) {

	int i=10;
	int j=1;

	while (i-->=0) {
		j*=2;
	}

	while (1);
}
As you may have noticed, we didn't declared the main symbol. That's because we will not make use of the standard C libaries nor the low-level initialisation code intended to boards.
Having no default libraries means that the loader will try to find the _start symbol (which in turn is supposd to call the main symbol), so we declare it.
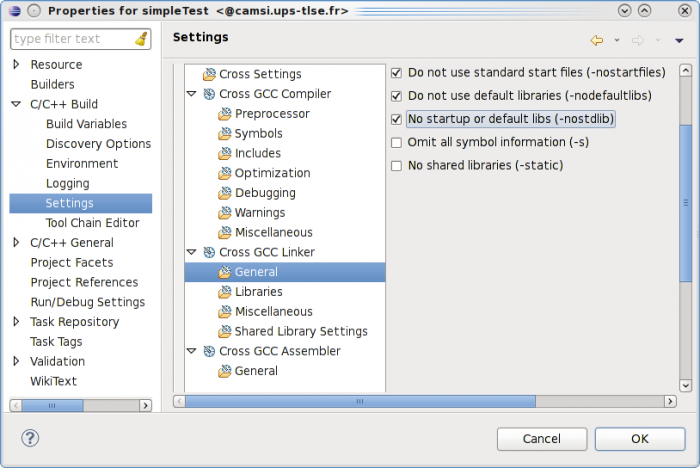
However, we ought to specifiy to the linker that it ought not to use all the default libraries: Project –> Properties
Next step is to build the binaries for the debug target (default). Eclipse console ought to display something that ought to looks like this:
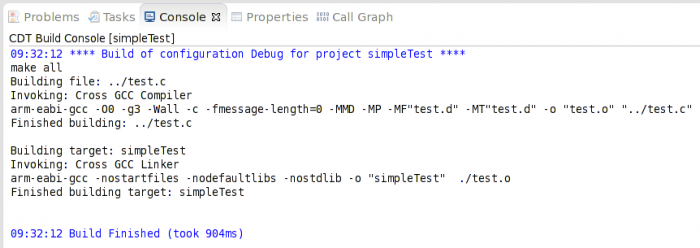
Now, we ought to setup the debug configuration. To do that, select the [arm/le] binary …
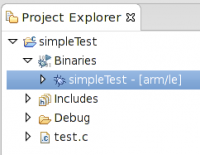
… then right click Debug As –> Debug Configurations and create a new C/C++ application debug configuration (double click)
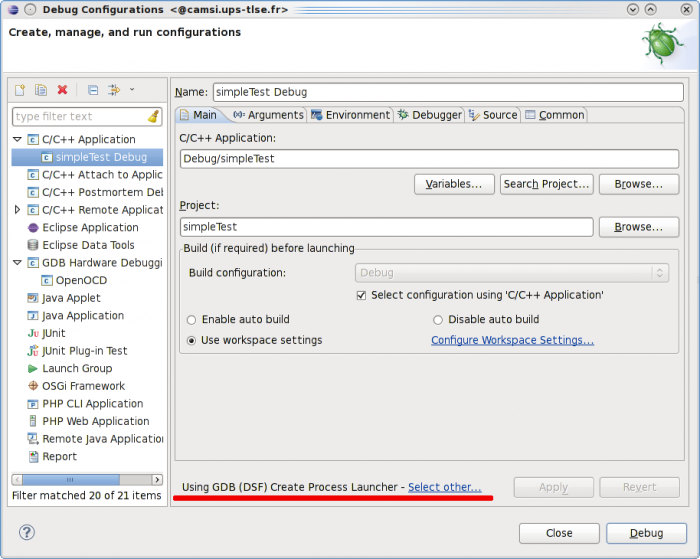
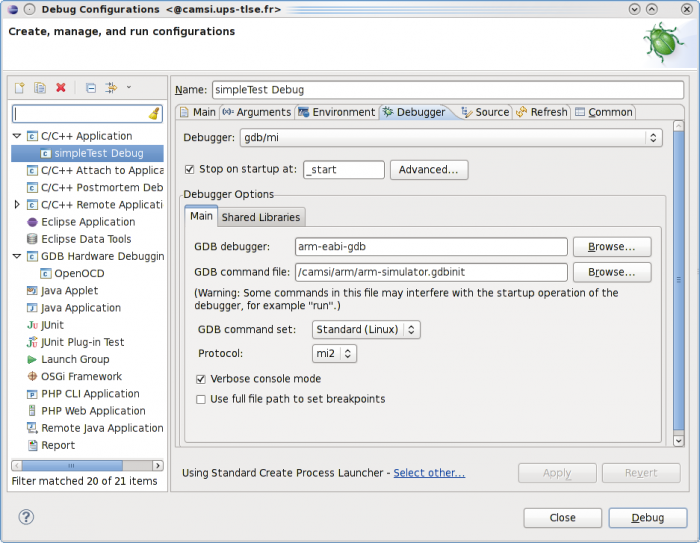
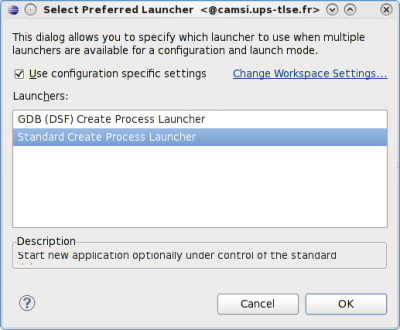
Now, a very important step is to specify the way Eclipse will call the GNU ARM debugger arm-eabi-gdb.
GDB (DSF) Create Process Launcher
Standard Create Process Launcher
The last setup step is to specify the GDB itself along with its init script and some other things as shown below:
arm-simulator.gdbinit configuration file
This file contains some hooks to make the arm-simulator to work within eclipse
set backtrace limit 10
target sim
load
Upon debug launch, you will be switched to the Debug perspective
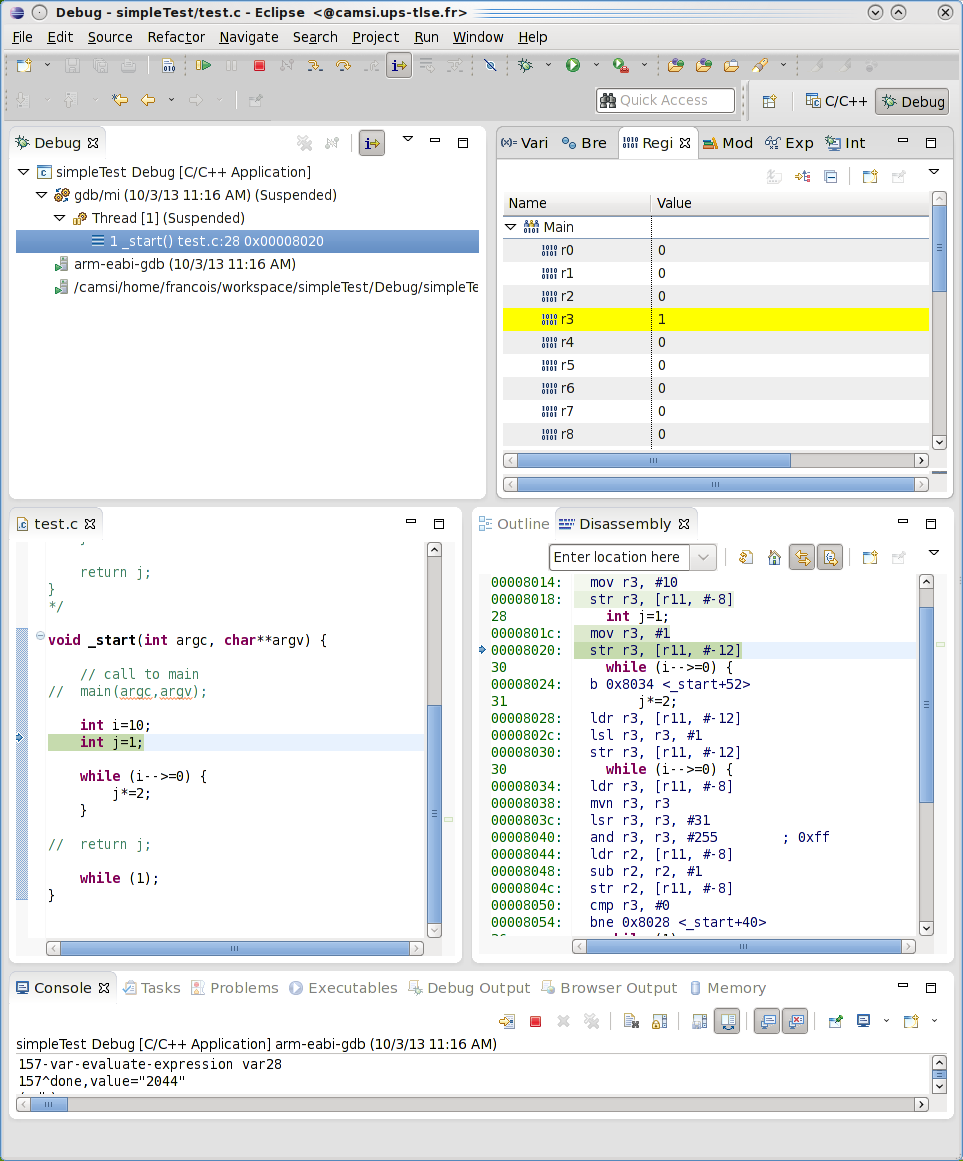
In this debug session, we added the following views:
- registers |
Window –> Show View –> Registers, - disassembly code |
Window –> Show View –> Disassembly
JTAG-OpenOCD
Lorem ipsum dolor sit amet, consectetur adipisicing elit, sed do eiusmod tempor incididunt ut labore et dolore magna aliqua. Ut enim ad minim veniam, quis nostrud exercitation ullamco laboris nisi ut aliquip ex ea commodo consequat. Duis aute irure dolor in reprehenderit in voluptate velit esse cillum dolore eu fugiat nulla pariatur. Excepteur sint occaecat cupidatat non proident, sunt in culpa qui officia deserunt mollit anim id est laborum.
to be continued ;)
 Except where otherwise noted, content on this wiki is licensed under the following license: CC Attribution-Share Alike 4.0 International